

Acoustic simulation testing
sound transmission
The frequency of sound is generally expressed in Hertz, denoted as Hz, which refers to the number of periodic vibrations per second. The decibel is the unit used to express the intensity of sound, recorded as dB.
Human ears generally can only hear sounds in the range of about 20Hz to 20,000 Hz (20kHz), and the upper limit will decrease with age.
In the frequency range that the human ear can perceive, 1,000~4,000Hz is the most sensitive, which is why we often use 1,000Hz as a basis for the performance value.
In the field of sound applications, what we mainly discuss is the wave phenomenon that propagates through the medium and can be perceived by the human auditory organ.
For this reason, we use fixtures with different openings, professional speakers & microphones & analyzers to detect the impact of media such as waterproof and breathable membranes on sound transmission during simulation.
ps: The test data we provide can be used as a reference, not as the final actual real data. We focus on the sound loss and the change on the curve for the attachment surface under different areas.
The equipment shown in the picture is only the same as our equipment, not the same item in the picture
Test Instrument
Mainly for omnidirectional microphone, acoustic analyzer, artificial mouth and acoustic software for analysis.
Test Method
Use a custom-made fixture to seal the microphone and leave an open area the size of the waterproof membrane. After the waterproof membrane is pasted, test the difference in sound before and after the waterproof membrane is attached.
Test Area
The test area can be customized according to the size of the customer, but it is mainly based on the commonly used area of the microphone.
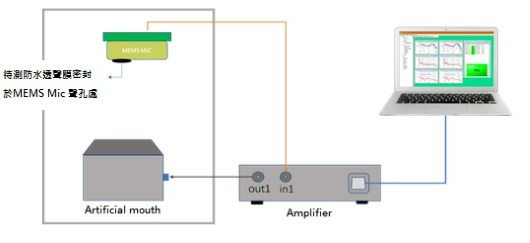
Schematic diagram of test equipment
The simple test equipment includes a directional microphone/artificial mouth/sound analyzer/computer and software, and then stick our products on jigs of different sizes to detect the effect on sound weakening according to different products.
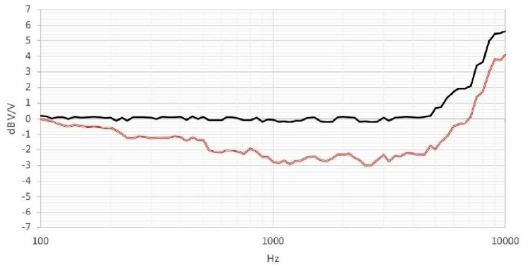
Sound loss test chart-1
The black line is the curve when the fixture with waterproof membrane is not installed, and the red line is the curve after installation. It can be clearly seen that there is a significant difference in sound loss compared with that before installation. One of the products of the water pressure series, compared with the products below which are mainly used for microphone applications, the performance is quite different. When the frequency is 1k Hz, the sound loss is greater than 3 dB loss.
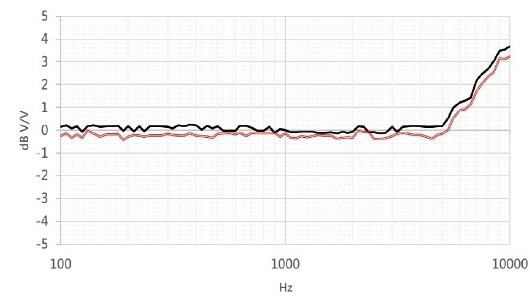
Sound loss test chart-2
The black line is the curve when the fixture with waterproof membrane is not installed, and the red line is the curve after installation. It can be clearly seen that there is a significant difference in sound loss compared to before installation, but the overall performance is quite good. , when the frequency is 1K Hz, the sound artifact is less than 1dB loss.